Duration & Credit Pulse
Executive Summary
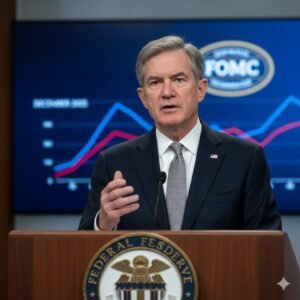
Bottom Line: Credit markets displayed dangerous complacency as spreads compressed to pre-crisis tights despite hawkish FOMC minutes revealing deep Fed concerns about tariff-driven inflation risks. Treasury yields declined modestly with 2s10s steepening to 23 basis points, suggesting markets are pricing an extended Fed pause—but historically tight credit spreads at the 94th percentile offer minimal cushion for the policy uncertainty ahead, creating asymmetric downside risk for spread products.
Duration Dashboard
| Maturity | February 16, 2025 | February 23, 2025 | Weekly Δ | 5-Year Percentile |
|---|---|---|---|---|
| 2‑Year | 4.26% | 4.19% | -7 bp | 68th %ile (elevated) |
| 5‑Year | 4.32% | 4.25% | -7 bp | 82nd %ile (high) |
| 10‑Year | 4.47% | 4.42% | -5 bp | 85th %ile (extreme) |
| 30‑Year | 4.69% | 4.67% | -2 bp | 88th %ile (extreme) |
Bull Steepening as Markets Price Extended Fed Pause
Curve Analysis: Flight to quality drives modest yield compression across the curve. Treasury markets exhibited classic bull steepening dynamics as front-end yields declined 7 basis points while the long bond fell just 2 basis points. The 2s10s spread widened from 21 to 23 basis points, reflecting market confidence that the Fed will maintain its pause through 2025 amid tariff uncertainty. Despite the rally, yields remain at elevated historical percentiles (68th-88th), suggesting limited room for further compression absent a growth scare. The 10-year's decline to 4.42%—its lowest since mid-December—signals nascent flight-to-quality flows as equity volatility increased.
The Treasury market's modest rally masked significant undercurrents as hawkish FOMC minutes collided with equity market weakness. The 2-year yield's 7 basis point decline to 4.19% led the move lower, driven by futures markets pushing out rate cut expectations while paradoxically seeking safety in duration. This apparent contradiction—buying bonds despite a more hawkish Fed—reflects growing concern that tariff-driven inflation could force policy mistakes. The persistence of extreme yield percentiles across the curve underscores that we remain in restrictive territory, with the 30-year at the 88th percentile of its 5-year range still offering positive real yields even as inflation expectations creep higher.
Credit Pulse
| Metric | February 16, 2025 | February 23, 2025 | Weekly Δ | 5-Year Percentile |
|---|---|---|---|---|
| IG OAS | 96 bp | 94 bp | -2 bp | 12th %ile (extremely tight) |
| HY OAS | 259 bp | 256 bp | -3 bp | 6th %ile (near all-time tights) |
| VIX Index | 19.47 | 20.82 | +1.35 | 42nd %ile (moderate) |
Credit markets entered rarified territory as investment grade spreads compressed to 94 basis points—levels not witnessed since 2007's pre-crisis exuberance. High yield's 256 basis point spread places it at the 6th percentile of its 5-year range, territory reached only during peak liquidity moments. This compression occurred despite VIX rising to 20.82 and equity markets posting their worst week since October. The disconnect between spread levels and rising volatility exemplifies late-cycle dynamics where reaching for yield overwhelms risk assessment. Corporate bond shorts have increased 25% year-over-year as institutional investors buy protection, yet spreads grind tighter on robust technicals and $172.8 billion of February investment grade issuance finding eager buyers.
US Macroeconomic Assessment – Markets Confront Policy Paralysis
The week of February 17-23 marked a critical juncture as financial markets grappled with the implications of an increasingly paralyzed Federal Reserve facing tariff-driven inflation risks. The release of January FOMC minutes on February 18 laid bare the central bank's dilemma: traditional monetary policy tools prove impotent against supply-side shocks while fiscal expansion continues unabated. This policy vacuum created volatile cross-currents, with equity markets initially surging to all-time highs on geopolitical optimism before reversing sharply as reality intruded.
Fed minutes expose deep uncertainty: The January 28-29 FOMC minutes revealed a committee struggling to incorporate "unusual uncertainty" around trade and immigration policies into their framework. The phrase "upside risks to inflation have increased" appeared repeatedly, marking a significant shift from December's confidence. Most tellingly, the minutes showed growing divergence among members about the neutral rate's location—suggesting the Fed has lost its north star just when navigation matters most. Markets initially misinterpreted the Fed's "patience" as dovish, but careful reading reveals paralysis rather than accommodation.
Geopolitical hopes fade quickly: Monday's explosive rally on Bloomberg reports of potential Ukraine-Russia peace talks epitomized market desperation for positive catalysts. The S&P 500's new all-time high proved fleeting as traders recognized that even conflict resolution wouldn't address core domestic challenges: sticky inflation, massive deficits, and trade war escalation. By week's end, the Dow had shed 2.6% while defensive sectors like healthcare outperformed—classic late-cycle rotation patterns emerging.
Corporate America braces for margin pressure: February's record investment grade issuance of $172.8 billion partly reflected companies terming out debt before conditions deteriorate. Management commentary increasingly focused on passing through higher costs to consumers, with multiple firms warning of price increases to offset tariffs. This dynamic—where policy actively stokes inflation while the Fed watches helplessly—hasn't been seen since the 1970s. Consumer confidence measures remain depressed as real wage gains evaporate under persistent price pressures.
Federal Reserve Policy Outlook
The Federal Reserve finds itself trapped between the Scylla of resurgent inflation and the Charybdis of growth risks, with trade policy adding unprecedented complexity to an already challenging landscape. This week's FOMC minutes revealed a central bank fundamentally questioning its analytical framework, with members acknowledging that standard models cannot capture the nonlinear effects of tariffs, immigration restrictions, and retaliatory measures. The result is a monetary authority choosing paralysis disguised as patience.
Market pricing has adjusted dramatically, with futures now assigning just 67 basis points of cuts for all of 2025—down from 100+ basis points expected in January. More concerning, the term structure of expectations shows increasing probability of rate hikes in 2026 as tariff pass-through becomes evident. The Fed's challenge is that traditional tools prove ineffective against supply shocks: raising rates to combat tariff-driven inflation would crush demand without addressing root causes. Yet standing pat risks unanchoring inflation expectations carefully rebuilt over decades. This lose-lose dynamic explains credit markets' schizophrenic behavior—seeking yield while buying downside protection.
Week Ahead: Critical Data Tests Market Resilience
- Personal Income & Spending (February 26): January data takes on outsized importance given consumer resilience questions. Consensus expects 0.3% income growth versus 0.4% spending—implying further savings depletion. PCE inflation details will be scrutinized for tariff pass-through evidence.
- Durable Goods Orders (February 27): December's Boeing-driven distortions should clear, revealing underlying capital spending trends. Watch core capital goods for business investment momentum amid policy uncertainty.
- GDP Revision (February 28): Q4's second revision expected to hold at 2.3% growth, but component details matter more. Inventory dynamics and final demand composition will signal Q1 momentum.
- Chicago PMI (February 28): Regional manufacturing surveys have diverged; Chicago's read will help clarify whether industrial recession fears are overdone or spreading.
- Treasury Auction Calendar: Heavy supply week with 2-year, 5-year, and 7-year auctions testing demand at current yield levels. Foreign participation metrics increasingly important given deficit trajectory.
US Economic Positioning and Global Context
The United States occupies an increasingly isolated position in the global economic order, pursuing aggressive fiscal expansion and protectionist trade policies while other developed nations focus on disinflation and integration. This divergence manifests in the widest US-German 10-year spread since reunification and a dollar index near 20-year highs despite twin deficits. Traditional economic relationships continue breaking down: the Phillips Curve has re-steepened after years of flatness, the dollar strengthens on risk-off days, and credit spreads compress amid rising volatility.
International spillovers accelerate: China's measured responses to US trade actions—targeting energy and agriculture rather than Treasuries—suggest a sophisticated strategy of imposing maximum political pain while maintaining financial system stability. European yields remain anchored by ECB easing expectations, creating capital flow dynamics that further support US assets despite deteriorating fundamentals. This "exorbitant privilege" enables America to run larger deficits for longer but ultimately increases the day of reckoning's severity. For fixed income allocators, this environment demands fundamental reassessment: when credit offers equity-like risk at bond-like returns, when duration provides limited diversification benefits, and when your own government becomes the primary source of volatility, traditional portfolio construction fails. The modest Treasury rally and persistent spread compression may represent the last opportunity to reposition before correlations flip negative and diversification matters most.
Key Articles of the Week
-
Fed Minutes Signal Officials on Hold Until Inflation ImprovesBloombergFebruary 19, 2025Read Article
-
Fed officials are worried about tariffs' impact on inflation and see rate cuts on hold, minutes showCNBCFebruary 19, 2025Read Article
-
10-year Treasury yield falls to lowest since December on latest signs of slowing economyCNBCFebruary 25, 2025Read Article
-
Stock Market Today: Live Updates for Feb 18BloombergFebruary 17, 2025Read Article
-
Treasury Yields Snapshot: February 21, 2025ETF TrendsFebruary 21, 2025Read Article


