Duration & Credit Pulse
Executive Summary
Bottom Line: Fed Chair Powell's Jackson Hole 2025 speech fundamentally shifted fixed income markets, driving 10-year Treasury yields down 6.4 basis points for the week as markets priced an 80%+ probability of a September rate cut. The dovish pivot came despite investment grade credit spreads sitting at 71 basis points—their tightest level in 25 years—while initial jobless claims jumped to 235,000, signaling potential labor market weakening that validates the Fed's evolving stance.
Duration Dashboard
| Maturity | August 17, 2025 | August 24, 2025 | Weekly Δ | 5-Year Percentile |
|---|---|---|---|---|
| 2‑Year | 3.75% | 3.70% | -5 bp | 43rd %ile (middle range) |
| 5‑Year | 3.84% | 3.76% | -8 bp | 52nd %ile (middle range) |
| 10‑Year | 4.32% | 4.26% | -6 bp | 75th %ile (elevated) |
| 30‑Year | 4.92% | 4.88% | -4 bp | 94th %ile (extreme) |
Jackson Hole Drives Broad Yield Compression
Curve Analysis: Treasury markets responded decisively to Powell's Jackson Hole pivot, with intermediate maturities leading the rally as 5-year yields fell 8 basis points. The 2s10s spread steepened modestly to 56 basis points from 57bp, while the 30-year yield's position at the 94th percentile of its 5-year range suggests limited room for further long-end compression. The parallel shift lower across the curve reflected broad-based rate cut expectations rather than recession fears.
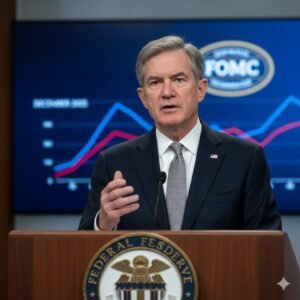
The Jackson Hole Economic Symposium dominated fixed income markets during the week of August 17-24, 2025, as Fed Chair Powell delivered what he termed his "eighth and final speech" at the annual gathering. The 10-year Treasury yield declined 6.4 basis points to close at 4.26%, with intraday swings exceeding 10bp following Powell's explicit acknowledgment that "risks to the labor market were rising." The speech marked a clear departure from the Fed's previous "higher for longer" stance, triggering an immediate repricing in rate cut probabilities from 37% to over 80% for the September FOMC meeting.
Credit Pulse
| Metric | August 17, 2025 | August 24, 2025 | Weekly Δ | 5-Year Percentile |
|---|---|---|---|---|
| IG OAS | 70 bp | 71 bp | +1 bp | 7th %ile (extremely low) |
| HY OAS | 263 bp | 262 bp | -1 bp | 11th %ile (low) |
| VIX Index | 15.09 | 14.22 | -0.87 | 15th %ile (low) |
Credit markets exhibited remarkable complacency despite the fundamental shift in Fed policy, with investment grade spreads holding at 71 basis points—the 7th percentile of their 5-year range and tightest levels since 1997. High yield spreads compressed marginally to 262bp, maintaining position at the 11th percentile despite growing economic uncertainties. The disconnect between ultra-tight spreads and rising jobless claims suggests credit investors remain convinced that Fed easing will extend the cycle rather than respond to deterioration.
September Issuance Wave: $175 Billion Technical Test
Credit markets face an immediate technical challenge as corporate issuers prepare to flood the primary market with an estimated $175 billion in September supply, with nearly half expected in the first week alone. This represents a 40% increase from typical September volumes and comes at a precarious moment with spreads at generational tights. Investment grade issuance year-to-date through July totaled $1.31 trillion, running 3.2% ahead of 2024's pace, while average daily trading volumes of $59.5 billion reflect a 15% year-over-year increase.
Jackson Hole 2025: Powell's Final Speech Reshapes Policy Expectations
The 2025 Jackson Hole Economic Symposium, themed "Labor Markets in Transition," provided the perfect backdrop for Powell's policy pivot. Speaking on August 22, the Fed Chair delivered unusually direct guidance that "with policy in restrictive territory, the baseline outlook and the shifting balance of risks may warrant adjusting our policy stance." This marked departure from previous communications sent Treasury yields tumbling across the curve, with the policy-sensitive 2-year yield falling 5.5 basis points for the week.
The FOMC minutes released August 20 had already revealed growing divisions within the committee, showing a 9-2 vote split at the July meeting—the first time multiple governors dissented in over 30 years. Governors Bowman and Waller had advocated for immediate easing, citing concerns about tariff impacts becoming "more apparent in the data." The minutes noted particular worry about the "timing, magnitude, and persistence" of inflation pressures from trade policies, with average tariff rates reaching 18.2% by July 2025.
US Macroeconomic Assessment – Labor Market Inflection Validates Fed Pivot
The week's economic data painted a clear picture of a labor market at an inflection point, justifying the Fed's dovish shift at Jackson Hole. Initial jobless claims jumped to 235,000 for the week ending August 16, exceeding consensus expectations of 225,000 and marking the highest level since June. The 11,000 weekly increase represented the sharpest rise since late May, while continuing claims climbed 30,000 to 1.972 million—dangerously close to the psychologically important 2 million threshold not seen since November 2021. This deterioration in both initial and continuing claims suggests not just increased layoffs but growing difficulty for displaced workers to find new employment.
Manufacturing divergence signals tariff fault lines: Regional manufacturing data showed dramatic disparities that directly correlate with tariff exposure. The Philadelphia Fed index plunged to -0.3 from 15.9, missing expectations by the widest margin in years, with the new orders component turning negative at -1.9. This region's concentration of import-dependent manufacturers explains the weakness. Conversely, the S&P Global Flash Manufacturing PMI jumped to 53.3, moving back into expansion territory, driven by domestic producers benefiting from 18.2% average tariff protection. This bifurcation—importers contracting while protected sectors expand—represents the clearest evidence yet of tariffs reshaping the industrial landscape. The services PMI at 55.4 captured the inflation consequence, with firms reporting the "steepest rise in average selling prices recorded over the past three years" explicitly due to tariff pass-through.
Housing resilience defies rate headwinds: Housing starts surprised to the upside, climbing 5.2% to 1.428 million units (SAAR), the biggest monthly increase in five months. However, building permits declined 2.8% to 1.354 million—the lowest since June 2020—suggesting future construction weakness ahead. Existing home sales beat expectations at 4.01 million units with median prices hitting a record $422,400, though year-over-year price growth decelerated sharply to just 0.2%, indicating significant cooling from pandemic-era appreciation rates.
Federal Reserve Policy Outlook: September Cut Now Base Case
Markets have dramatically repriced Fed expectations following Jackson Hole, with CME FedWatch showing an 82.1% probability of a 25 basis point cut at the September 16-17 FOMC meeting. This represents a complete reversal from just a week ago when markets saw less than 40% odds of near-term easing. Powell's explicit recognition that labor market risks now dominate inflation concerns gives the Committee political cover to begin normalizing policy despite core PCE still running above the 2% target.
The removal of "makeup strategy" language from the Fed's framework, announced during Jackson Hole week, signals acceptance that the inflation overshoot has run its course. More significantly, the framework change eliminates the commitment to run inflation hot after periods below target, giving the Fed flexibility to cut rates even with inflation settling modestly above 2%. With unemployment claims rising and manufacturing surveys weakening, the September meeting increasingly looks like the start of an extended easing cycle rather than an isolated "insurance" cut.
Trade Policy Monitor: Tariffs at 90-Year Highs
US average tariff rates reached 18.2% by August 2025, the highest level since 1934's Smoot-Hawley era, fundamentally altering inflation dynamics and corporate supply chains. The week saw continued escalation with India facing an additional 25% tariff starting August 27, bringing total levies to 50% on the subcontinent's exports. While the US-China tariff pause achieved through Swedish negotiations temporarily reduced rates—US tariffs dropped from 145% to 30% and Chinese rates from 125% to 10%—the pause's August 12 expiration required presidential approval for extension, adding policy uncertainty.
Manufacturing PMI divergence directly reflects tariff impacts: import-dependent manufacturers reported sharp contractions (Philadelphia Fed at -0.3) while protected domestic producers expanded (S&P Global at 53.3). The services sector noted the "steepest rise in average selling prices recorded over the past three years," with firms explicitly citing tariff pass-through. Energy and cable/satellite credit sectors showed particular stress, posting -85bp and -95bp excess returns respectively during tariff-related volatility episodes, suggesting investors are beginning to differentiate between tariff winners and losers.
Currency & Capital Flows Dashboard
| Indicator | Current Level | YTD Change | Implications |
|---|---|---|---|
| US Dollar Index | 98.20 | -9.0% | Steepest annual decline since 2020 |
| Gold Price | $3,374/oz | +34.5% | Haven demand despite risk-on tone |
| Foreign Treasury Holdings | $254.3B (March) | +12.0% | Sustained demand despite dollar weakness |
| US Credit Rating | Aa1/AA+/AA+ | Moody's ↓ May | Lost top rating from all 3 agencies |
The paradox of strong foreign Treasury demand amid sharp dollar weakness reflects global investors' limited alternatives for liquid, safe assets despite US fiscal deterioration. Moody's May 2025 downgrade to Aa1 means the US has now lost its pristine AAA rating from all three major agencies—S&P (2011), Fitch (2023), and now Moody's—yet Treasury yields continue to decline on Fed pivot expectations. This disconnect between sovereign credit quality and yield levels suggests either markets expect aggressive Fed support or term premium remains dangerously compressed.
Week Ahead: Critical Data Points
- Personal Income & Spending (August 30): Core PCE inflation expected at 0.2% monthly; any upside surprise could complicate September rate cut narrative given 82% market probability.
- Jobs Report (September 6): August payrolls arrive just 10 days before FOMC decision. Market looking for 165,000 jobs with unemployment at 4.3%—weakness would cement rate cut.
- ISM Manufacturing (September 3): Critical for confirming manufacturing recession fears. Consensus expects 47.5 from 46.8, but regional divergence suggests wide dispersion possible.
Global Context: Dollar Weakness Accelerates on Fed Pivot
The US Dollar Index declined to 98.2 following Powell's Jackson Hole speech, down nearly 9% year-to-date in its steepest annual decline since 2020. The combination of anticipated Fed easing and persistent twin deficits—fiscal deficit approaching 7% of GDP and trade deficit at $131 billion monthly—creates structural headwinds for the greenback. Gold prices held near $3,374 per ounce, up 34.5% year-over-year, reflecting both dollar weakness and persistent safe-haven demand.
Central banks navigate diverging paths: While the Fed pivots dovish, global peers maintain varied stances. The ECB held rates at 2.0% at its July meeting, with Lagarde describing conditions as "exceptionally uncertain, especially because of trade disputes." The Bank of Japan kept policy at 0.50% but hinted at potential year-end tightening. This divergence in monetary policy trajectories, combined with US political uncertainty ahead of 2025 elections, suggests continued volatility in currency and bond markets. For fixed income investors, the Fed's pivot while credit spreads remain at generational tights creates an unusual dynamic where both duration and credit risk appear mispriced relative to emerging economic uncertainties.
Frequently Asked Questions
What did Powell say at Jackson Hole 2025 that moved markets?
Powell explicitly stated that "risks to the labor market were rising" and policy adjustments may be warranted, marking a clear shift from the Fed's previous stance. This drove Treasury yields down 6-8 basis points across the curve and pushed September rate cut probability above 80%.
Why are credit spreads so tight despite economic uncertainty?
Investment grade spreads at 71 basis points reflect investor belief that Fed rate cuts will extend the economic cycle. However, at the 7th percentile of their 5-year range, spreads offer minimal compensation for risk, creating asymmetric downside potential.
How do jobless claims at 235,000 compare historically?
The 235,000 initial claims level marks the highest reading since June 2025, with the 11,000 weekly increase being the sharpest rise in three months. Continuing claims at 1.97 million approach levels not seen since late 2021, validating Fed concerns about labor market softening.
What does the Treasury yield curve shape tell us about recession risk?
The 2s10s spread at 56 basis points remains positively sloped, suggesting markets don't see imminent recession. However, the 30-year yield at the 94th percentile of its range indicates long-term inflation concerns persist despite near-term easing expectations.
Key Articles of the Week
-
Powell's Speech Jackson Hole 2025: Live News, Market ReactionsBloombergAugust 22, 2025Read Article
-
Flash US PMI signals faster growth and hiring, but also shows tariff-driven inflationS&P GlobalAugust 21, 2025Read Article
-
US Jobless Claims Rise, Continuing Filings Highest Since 2021BloombergAugust 21, 2025Read Article
-
Divided Fed worried about tariffs, inflation and the labor market, minutes showCNBCAugust 20, 2025Read Article
-
New Residential Construction Press ReleaseU.S. Census BureauAugust 20, 2025Read Article
-
Daily: US IG spreads narrow to a 25-year lowUBS GlobalAugust 19, 2025Read Article
-
UBP Weekly View - Markets rally after Jackson Hole symposiumUnion Bancaire PrivéeAugust 23, 2025Read Article
-
Weekly fixed income commentaryNuveenAugust 25, 2025Read Article


